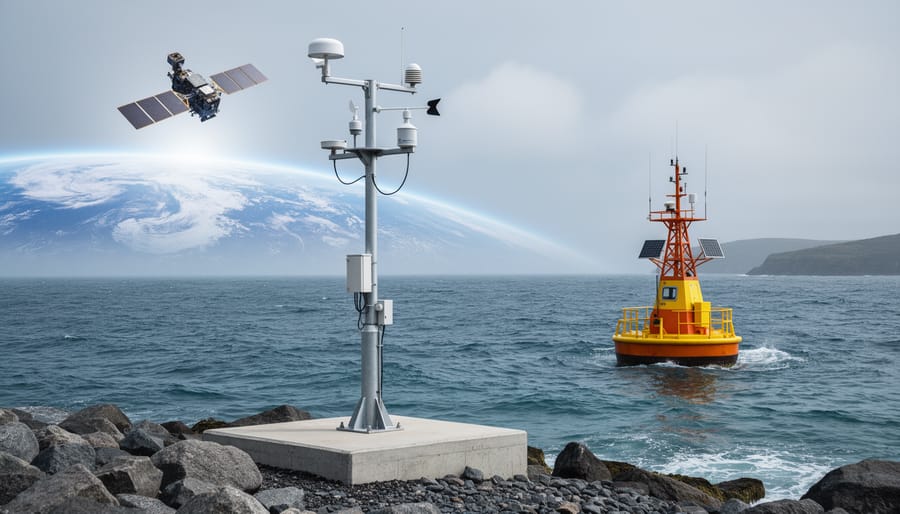
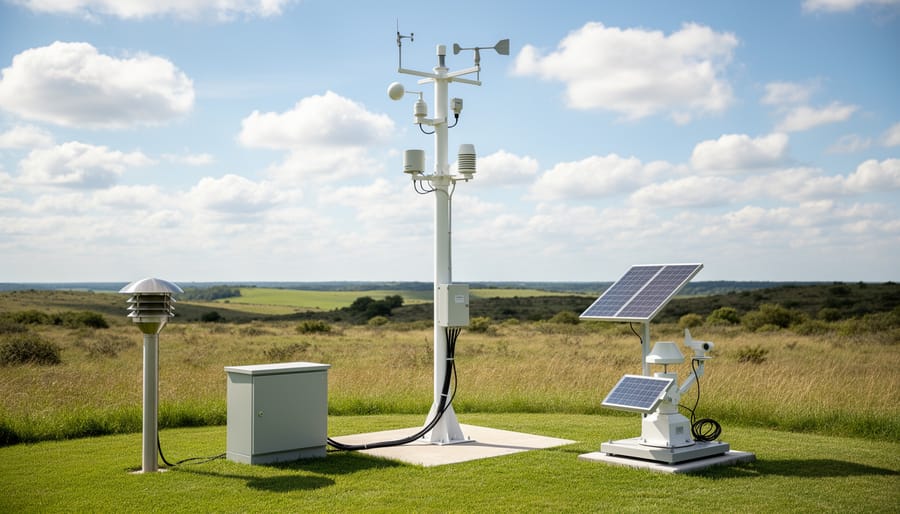
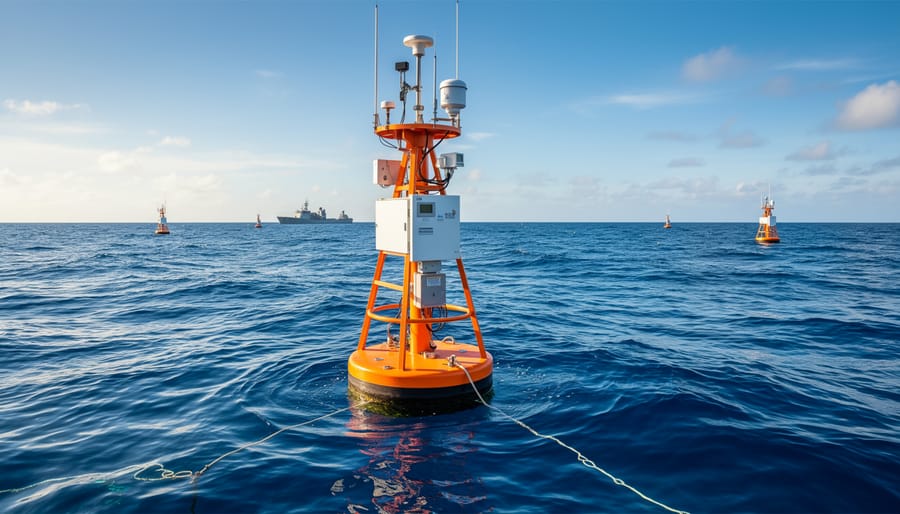
You can’t tackle what causes climate change without first understanding how scientists track it. Climate measurement relies on three core methods: weather stations recording temperature, precipitation, and wind patterns across decades; satellites capturing real-time data on ice coverage, sea levels, and atmospheric composition from space; and ocean buoys monitoring water temperature and acidity changes. Scientists combine these readings with ice core samples that reveal atmospheric conditions from thousands of years ago, creating a comprehensive picture of long-term climate trends versus short-term weather fluctuations.
This matters because accurate measurement transforms climate action from guesswork into strategy. Whether you’re a student researching environmental science, an activist building a case for policy change, or simply someone who wants straight answers, understanding measurement methods helps you interpret climate data confidently. The tools tracking our planet’s health have never been more sophisticated or accessible, giving young people across the political spectrum the evidence they need to drive meaningful change in their communities.
The Foundation: What We’re Actually Measuring
Weather tells you whether to grab an umbrella today. Climate tells you whether your region will still have reliable rainfall in thirty years.
That distinction matters because measuring climate means tracking long-term patterns, not daily fluctuations. Scientists typically examine data spanning at least thirty years to identify genuine climate trends rather than short-term noise. When we talk about measuring climate change, we’re looking at shifts in these multi-decade averages that reveal how Earth’s systems are responding to rising greenhouse gas levels.
The metrics scientists track fall into five core categories. Greenhouse gas concentrations come first, particularly carbon dioxide, methane, and nitrous oxide trapped in the atmosphere. These gases drive warming, and researchers measure them in parts per million or as carbon dioxide equivalents. Temperature changes represent the most visible signal, tracked through global surface temperatures, ocean heat content, and atmospheric warming patterns. Sea level rise metrics reveal how melting ice and expanding warmer water are reshaping coastlines. Ice mass measurements capture the retreat of glaciers and polar ice sheets. Precipitation patterns show where droughts are intensifying and where extreme rainfall events are becoming more common.
- MtCO2e (Megatonnes of CO2 equivalent)
- A standardized unit that converts all greenhouse gases into the warming impact of carbon dioxide, letting scientists compare methane, nitrous oxide, and other gases on equal footing. Canada’s 2023 emissions totaled 694 MtCO2e.
- Temperature anomaly
- The difference between current temperatures and a baseline average, typically measured against pre-industrial levels or a reference period like 1951-1980. Scientists use anomalies rather than absolute temperatures to track warming trends consistently across regions.
- Baseline period
- A reference timeframe used to measure progress toward climate goals. Canada uses 2005 levels as its baseline, showing an 8.5% emissions reduction by 2023 against that benchmark.
- Global mean sea level
- The average height of the ocean’s surface worldwide, adjusted for local variations. Rising seas result from thermal expansion as water warms and from meltwater added by shrinking ice sheets and glaciers.
These metrics work together like instruments in an orchestra, each contributing essential information about how rapidly our planet is changing. No single measurement tells the whole story, but combined they create a comprehensive picture accessible to researchers, policymakers, and citizens regardless of background or political perspective.
The IPCC Method: How Countries Track Their Emissions
The Three Working Groups
The IPCC divides its work into three specialized groups, each tackling a different piece of the climate puzzle. Working Group I assesses the physical science of climate change, the hard data on temperatures, greenhouse gases, and Earth’s changing systems. Working Group II examines impacts and adaptation, studying how climate change affects ecosystems, communities, and economies, and what strategies help us adapt. Working Group III focuses on mitigation: the methods for reducing emissions and removing greenhouse gases from the atmosphere.
This division ensures comprehensive coverage. While Groups I and II measure what’s happening and its consequences, Group III evaluates the solutions, from renewable energy deployment to carbon capture technologies. Together, they create a complete framework for understanding not just how climate is measured, but how that measurement informs action. For young people entering climate-related careers, this structure reveals the diverse pathways available: some scientists track the changes, others study the impacts, and still others design the solutions. Each group’s work feeds into national strategies like Canada’s emission reduction targets, transforming measurement into meaningful policy regardless of political approach.
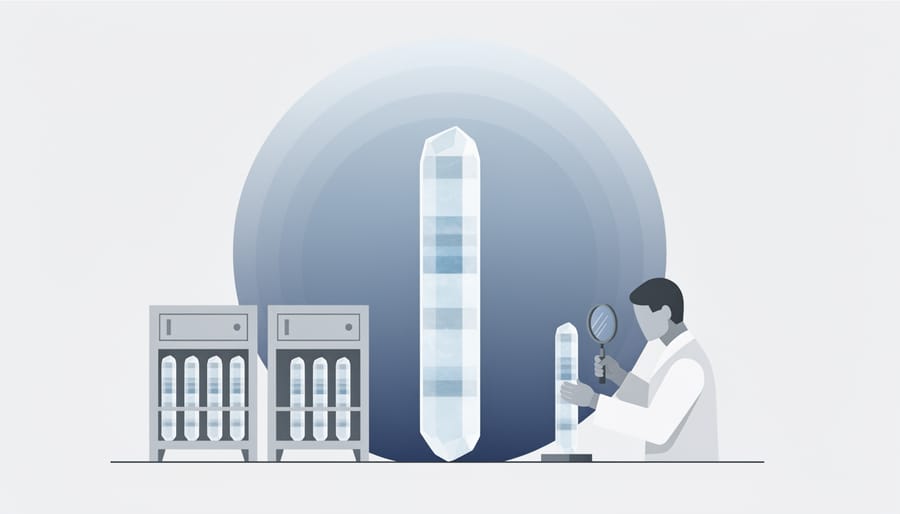
From Satellites to Sensors: The Tools of Climate Measurement
Measuring our changing climate requires a sophisticated web of technologies working in concert. Earth-observation satellites circle the planet, monitoring everything from atmospheric carbon dioxide concentrations to shrinking ice sheets. NASA’s Orbiting Carbon Observatory tracks CO2 levels with precision, while the European Space Agency’s Sentinel satellites measure sea surface temperatures and monitor deforestation patterns that affect carbon storage.
On the ground, thousands of weather stations record temperature, precipitation, and atmospheric pressure at specific locations. Ocean buoys bob across the seas, measuring water temperature, salinity, and acidity, critical indicators of how our oceans absorb heat and carbon. These sensors transmit data continuously, creating real-time snapshots that scientists can access regardless of where they work or their political perspectives.
Some of our most valuable climate records come from ice cores drilled in Antarctica and Greenland. By analyzing trapped air bubbles in ice layers formed over millennia, researchers can reconstruct atmospheric conditions stretching back 800,000 years. This historical context helps distinguish natural climate variation from human-caused changes.
Atmospheric sensors deployed worldwide measure greenhouse gas concentrations with remarkable accuracy. The Mauna Loa Observatory in Hawaii has tracked rising CO2 levels since 1958, providing an unbroken record that informed the standardized measurement methods the IPCC developed in 2006. These same protocols guide how nations like Canada calculated their 2023 emissions at 694 MtCO2e.
This global network doesn’t belong to any single nation or political ideology. It creates a shared foundation of evidence that everyone can use, whether you’re advocating for wind farms, supporting nuclear energy, promoting carbon capture technology, or developing market-based climate solutions. The data itself remains neutral, empowering diverse approaches to the same challenge: protecting the planet we all share.
Setting Baselines and Tracking Progress
Without reference years, measuring climate progress would be like tracking a journey without knowing where you started. Scientists establish baseline years, commonly 2005 for many international agreements, to create a fixed starting point against which all future changes are measured. This approach transforms abstract greenhouse gas data into concrete, trackable goals that policymakers, businesses, and citizens across the political spectrum can understand and act upon.
Canada’s 2026 interim target illustrates how baselines work in practice. The country aims to reduce emissions by 20% below 2005 levels, when national emissions served as the benchmark. In 2023, Canada reached 694 MtCO2e, an 8.5% reduction from that baseline. This measurement framework allows everyone from conservative fiscal planners to progressive environmental advocates to evaluate progress using the same objective data, removing political interpretation from the underlying science.
These reference points matter beyond national policy. Local governments use the same baseline approach to measure improvements in air quality and emissions reductions within their communities. A city that reduced emissions 15% below its 2005 baseline has achieved something quantifiable, whether the mayor runs as a Republican or Democrat. The baseline doesn’t care about party affiliation, it only tracks whether concentrations are rising or falling.
The IPCC’s standardized methodology ensures these measurements remain consistent across borders and political systems. When every country calculates its inventory using the same 2006 IPCC Guidelines, a metric ton of carbon dioxide means exactly the same thing in Vancouver as it does in Texas. This scientific consistency creates the foundation for international cooperation and domestic action plans that transcend ideological divisions.
Why Accurate Measurement Empowers Your Climate Action
Understanding how climate is measured gives you real power to make a difference. When you know that Canada reported 694 MtCO2e in 2023, representing an 8.5% reduction below 2005 levels, you can evaluate whether your government is meeting its commitments or needs more pressure from citizens like you. This knowledge transforms climate awareness from abstract concern into concrete action.
Young advocates who understand these metrics can hold leaders accountable across party lines. Whether you’re speaking at a town hall, writing to representatives, or engaging with your community, citing specific measurement standards and progress data makes your voice harder to dismiss. You’re not sharing opinions but verifiable facts grounded in the same IPCC methodology that governments worldwide use to track their commitments.
This measurement science also helps you evaluate renewable energy claims and corporate sustainability promises. When a company announces carbon neutrality or a politician champions a new climate policy, you can examine the actual data behind these statements. Are emissions genuinely falling, or is it accounting tricks? The tools you’ve learned about enable you to ask the right questions.
The climate measurement sector itself is creating thousands of careers for young professionals. From atmospheric scientists and data analysts to satellite technicians and environmental engineers, this field needs people who understand both the science and its real-world applications. Jobs in monitoring, verification and clean energy technology offer meaningful work that builds the sustainable economy we all depend on, regardless of political affiliation.
Understanding how climate is measured gives you something more valuable than data points: it gives you common ground. When you know that scientists worldwide use the same IPCC guidelines, track the same atmospheric readings, and analyze the same satellite data, you recognize that climate measurement transcends political divisions. These methods produce facts that both renewable energy entrepreneurs and traditional energy workers can discuss, that both urban activists and rural landowners can reference, that both progressive and conservative policymakers must address.
This shared foundation makes meaningful action possible. Whether you’re advocating for clean energy investments that create jobs, supporting farmers adapting to changing precipitation patterns, or pushing for accountability on emissions targets, you’re standing on the same measured ground. The tools tracking our planet’s health don’t care about party affiliation. They simply record what’s happening.
Your generation faces the challenge of building a sustainable economy, but you also inherit the most sophisticated climate measurement systems humanity has ever created. Use them. Question leaders who ignore the data. Support solutions backed by evidence. Connect with others across traditional divides who recognize what the measurements show.
The planet we all share is sending clear signals. Now that you understand how we measure them, you’re equipped to respond with both urgency and hope.