
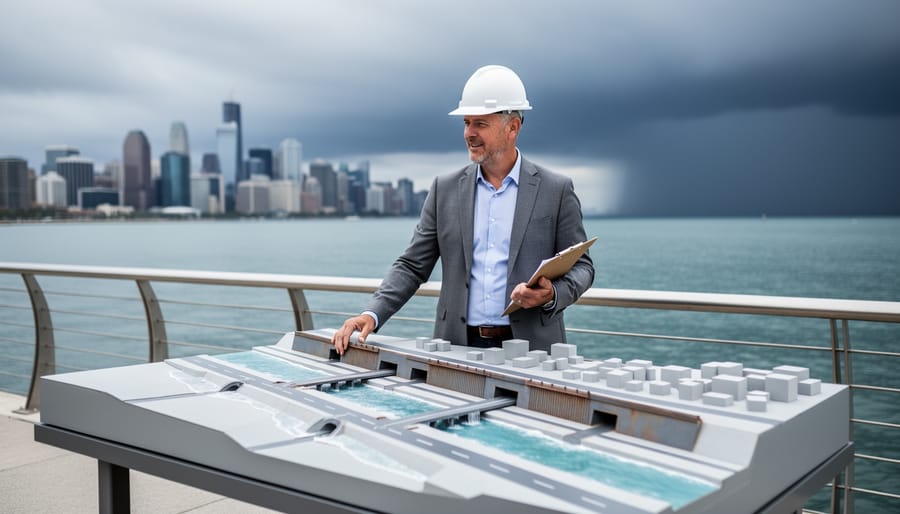


Climate change facts are the measurable, evidence-based data points about Earth’s changing climate that urban planners use to design resilient cities and guide adaptation strategies. These facts include rising global temperatures, increased frequency of extreme weather events, sea-level projections, and shifting precipitation patterns that directly inform how communities build infrastructure, zone land, and prepare for future conditions.
For anyone looking to understand how cities respond to climate realities, the connection between data and design is where science meets action. A coastal planner uses projected sea-level rise to determine levee heights. A transportation engineer references heat wave data to select pavement materials that won’t buckle. A housing developer considers flood maps before breaking ground. Climate facts aren’t abstract warnings; they’re the foundation of every forward-thinking urban decision being made in 2026.
This article breaks down the climate facts that matter most for urban environments, explains how planners translate raw data into actionable strategies, and explores the categories of responses cities are implementing right now. You’ll see real examples of communities turning projections into protection and learn how bipartisan collaboration is making climate-informed planning possible across political divides.
Whether you’re a student curious about sustainable careers, a resident wondering why your city is redesigning stormwater systems, or simply someone who wants to understand how facts drive solutions, this guide connects the dots between climate science and the places we live. The good news is that cities have more tools, data, and momentum than ever to adapt effectively. Understanding the facts is the first step toward building communities that thrive in a changing climate, and young advocates are already leading the charge in demanding evidence-based action.
The Core Climate Change Facts Shaping Urban Planning
Urban planners base their work on observable, measurable climate change facts rather than distant forecasts. The difference matters: a climate fact is what we can measure now or have already documented, rising sea levels, shifting precipitation patterns, hotter average temperatures. These aren’t speculative; they’re recorded data points that inform decisions regardless of political affiliation. Evidence-based planning works because it grounds policy in what’s happening today, making climate-responsive design a practical necessity rather than an ideological choice.
Several core facts shape every urban planning decision in 2026. Global temperatures have risen approximately 1.1°C above pre-industrial levels, with cities experiencing even more pronounced warming due to heat island effects. The IPCC on rising risks confirms that extreme weather events now occur with greater frequency and intensity, information that directly influences building codes, insurance requirements, and infrastructure investment timelines.
- Rising Temperatures
- Documented increase in average global and urban temperatures, with cities warming faster than surrounding areas. This fact drives decisions about cooling infrastructure, heat-emergency protocols, and urban tree canopy coverage.
- Sea Level Rise
- Measured upward trend in ocean levels tracked by NOAA sea level trends affecting coastal city planning. Planners use this data to determine setback requirements, flood zone designations, and stormwater system capacity.
- Increased Flooding Frequency
- Observable rise in both coastal and inland flood events, documented through municipal records and insurance claims. This fact informs drainage system upgrades, permeable surface requirements, and development restrictions in flood-prone areas.
- Extreme Weather Patterns
- Measured changes in precipitation intensity, drought duration, and storm severity based on historical weather records. Urban planners apply this data when designing emergency response networks and climate-proof transportation systems.
These measurable realities tie directly to the drivers of climate change that scientists have documented for decades. What makes this data powerful for planners is its bipartisan acceptance, everyone can see the flood records, temperature charts, and sea level measurements. A city’s 100-year flood happening three times in ten years isn’t a political statement; it’s a fact that requires updated infrastructure standards.
Evidence-based planning also creates opportunities. Young professionals entering urban planning, climate data analysis, and resilient infrastructure design find their skills in high demand precisely because cities need experts who can translate climate facts into protective measures. The work spans political divides because protecting communities from documented risks appeals across the spectrum.
How Climate Facts Drive Urban Planning Decisions
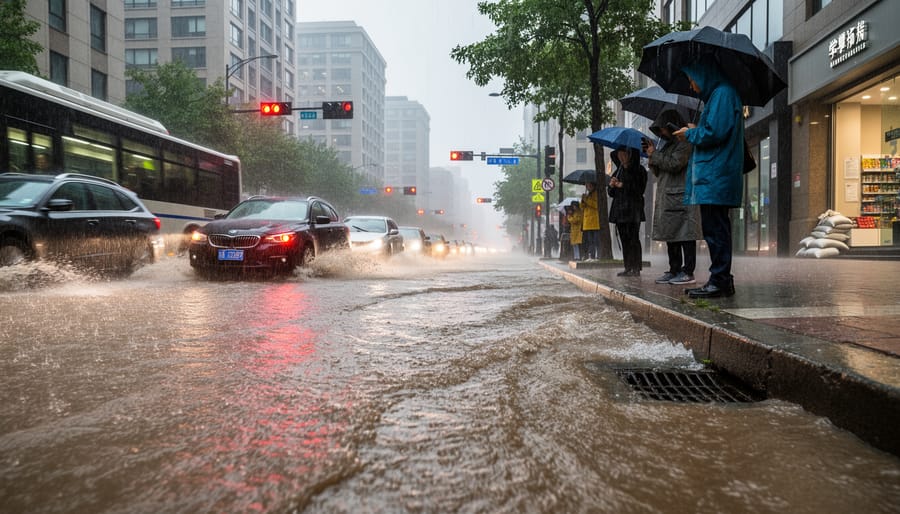
Climate science reaches city hall through a structured process that transforms raw data into livable neighborhoods. Urban planners begin by reviewing regional climate projections from sources like NOAA and local university research centers, focusing on specific threats their city faces: whether that’s six inches of sea level rise by 2050, fifteen additional days above 95°F annually, or doubling of 100-year flood frequency. These aren’t abstract warnings. They’re engineering parameters that determine where homes can safely stand and which roads will become impassable.
The workflow from data to decisions typically starts with a vulnerability assessment. Planning departments map critical infrastructure, hospitals, schools, power stations, water treatment facilities, against projected climate hazards. A coastal city might overlay storm surge models with existing development patterns, revealing that the main evacuation route floods in category-2 hurricanes. An inland city might map health impacts from heat islands against neighborhoods lacking tree canopy. This spatial analysis creates a clear picture of where intervention matters most.
Planners then translate these findings into regulatory tools. Zoning laws get updated to restrict development in newly identified flood zones or require ground-floor commercial spaces in areas projected to flood regularly. Building codes incorporate higher wind resistance standards, mandate cool roofs in heat-prone districts, or require stormwater retention systems that handle the new 100-year storm, which might be 30% more intense than historical records. Infrastructure budgets shift accordingly. A city facing increased rainfall allocates more funding for expanded culverts and permeable pavement instead of just repaving with traditional asphalt.
Green space allocation becomes strategic rather than aesthetic. Parks aren’t just amenities, they’re flood storage basins during extreme rain events and cooling zones during heat waves. Minneapolis, for example, uses its chain of lakes and parks as a connected climate resilience network, while Phoenix plants drought-tolerant trees along streets where pavement temperatures regularly exceed 160°F.
Throughout this process, stakeholder engagement shapes the final plans. Public hearings bring together homeowners worried about property values, developers concerned about construction costs, environmental advocates pushing for aggressive action, and budget-conscious taxpayers questioning expenses. The most effective planning processes navigate policy barriers by framing climate adaptation as risk management rather than environmental politics, everyone benefits from roads that don’t flood and neighborhoods that stay cooler.
Bipartisan collaboration emerges when the conversation centers on protecting existing investments. Conservative and progressive council members often align on infrastructure upgrades once they understand that inaction costs more than preparation. The timeline from climate fact to implemented policy typically spans two to five years, depending on regulatory complexity and funding availability, but the underlying principle remains constant: credible climate data provides the foundation for decisions that keep cities functional as conditions change.
Types of Climate-Responsive Urban Planning Strategies
Mitigation-Focused Urban Design
Cities can cut their carbon footprints dramatically by designing neighborhoods that reduce the need for car trips and fossil fuel consumption. The climate facts are clear: urban areas produce roughly 75% of global greenhouse gas emissions, yet they also offer the greatest leverage points for emissions reductions through smart design choices that work across political divides.
Transit-oriented development concentrates housing, offices, and retail around subway stations, light rail stops, and bus hubs. Residents in these neighborhoods drive 60% less than those in car-dependent suburbs, directly cutting transportation emissions that account for the largest share of most cities’ carbon budgets. This approach also creates walkable, economically vibrant districts that attract young professionals and reduce infrastructure costs.
Renewable energy integration transforms buildings from energy consumers to potential power generators. Cities now mandate solar-ready roofs on new construction, install community solar arrays on municipal buildings, and create district energy networks that share geothermal or waste heat. Chicago’s green building standards require large developments to meet energy performance targets, cutting building emissions by 20-30% compared to conventional construction.
Energy-efficient building codes address the climate fact that buildings consume 40% of U.S. energy. Modern standards require better insulation, high-efficiency HVAC systems, and smart controls that reduce heating and cooling loads. These codes create construction jobs while lowering utility bills for residents.
Walkable neighborhood design makes daily errands possible without a car. Mixed-use zoning puts grocery stores, schools, and services within a ten-minute walk of homes, reducing vehicle miles traveled and creating healthier, more connected communities where climate action happens through everyday choices.
Adaptation and Resilience Planning
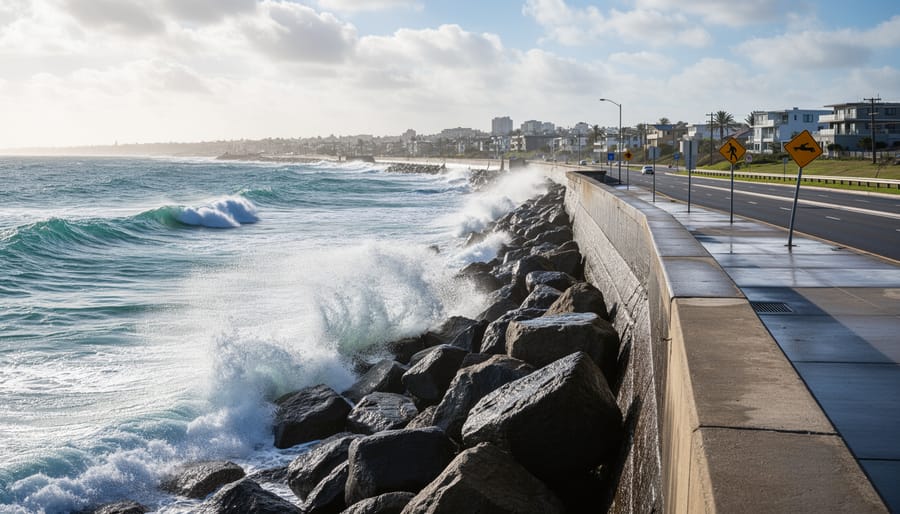
Adaptation planning translates climate change facts into physical systems that protect people when extreme weather hits. Cities confronting documented increases in flooding frequency now install bioswales and retention ponds that capture stormwater before it overwhelms sewer systems. Miami Beach elevated 110 streets and installed high-capacity pumps after tide gauge data confirmed accelerating sea level rise. These aren’t theoretical preparations, they respond to measured changes already underway.
Heat island reduction addresses the climate fact that urban areas run 5-9°F hotter than surrounding regions, with asphalt and concrete absorbing and radiating heat. Phoenix planted 13,000 shade trees along transit routes and painted select rooftops with reflective coatings, cutting surface temperatures by 40°F in treated areas. Cool pavement programs in Los Angeles use lighter-colored materials that reflect rather than trap solar radiation. The interventions cost less than treating heat-related illnesses that spike during record-breaking summers.
Climate-proof transportation networks anticipate disruptions documented in temperature and precipitation records. New York’s subway system installed flood barriers and raised ventilation grates after Superstorm Sandy caused $5 billion in damage. Boston redesigned drainage around rail lines prone to washouts during nor’easters. Emergency response infrastructure now includes backup power for shelters, pre-positioned supplies in flood zones, and communication systems that function during grid failures.
These strategies share a common foundation: they start with verified climate data showing what has changed and build systems to handle the impacts those facts predict. Every flood gate and shade tree represents a city choosing resilience over hoping conditions stay the same.
Green Infrastructure and Nature-Based Solutions
Green infrastructure uses living systems to solve problems that climate facts have made urgent. When cities plant street trees, they’re deploying a proven technology: a single mature tree can intercept 1,000 gallons of stormwater annually and cool surrounding air by up to 9°F through shade and transpiration. Urban forests now form the backbone of many cities’ heat reduction strategies, targeting neighborhoods where temperature differences can reach 15-20°F between tree-lined streets and barren asphalt.
Green roofs and permeable pavements tackle the flooding increases that climate data predicts. A green roof absorbs 50-90% of rainfall before it enters storm drains, while permeable concrete allows water to filter naturally into soil rather than overwhelming aging infrastructure. These solutions cost less than traditional gray infrastructure over their lifespan and deliver multiple benefits simultaneously.
Wetland restoration represents nature-based defense against both flooding and drought. Restored urban wetlands act as sponges during storms and release water slowly during dry periods, buffering cities against the precipitation extremes now documented in climate records. Philadelphia’s green infrastructure program has converted thousands of acres to natural stormwater management, reducing combined sewer overflows while creating public green space and local jobs in landscape maintenance and ecological restoration.
Real-World Applications: Where Climate Facts Meet City Streets
Cities across the country are putting climate facts to work in ways that protect communities and create opportunities regardless of political affiliation. The transition from data to action looks different in each location, but every example demonstrates how evidence-based planning produces tangible results.
Coastal cities face the most immediate challenges from sea level rise, and their responses showcase climate facts in action. Miami Beach has invested over $500 million in raising roads, installing pump systems, and redesigning stormwater infrastructure based on sea level projections. Charleston redesigned its historic district drainage using flood frequency data, while Norfolk works with military installations on shared resilience planning, a collaboration that bridges civilian and defense priorities. These cities prove that acknowledging water level trends isn’t partisan; it’s practical governance that protects property values and saves lives.
Inland cities translate heat and drought facts into urban design that keeps people safe during extreme weather. Phoenix uses temperature data to map heat vulnerability and plant 100,000 trees in underserved neighborhoods by 2030. Kansas City adopted a climate action plan with bipartisan council support after drought impacts threatened the regional economy. Detroit turned vacant lots into stormwater management sites that also cool neighborhoods, addressing both precipitation changes and economic recovery simultaneously.
Growing cities are planning proactively for climate migration and changing demographics:
– Duluth markets itself as a climate refuge city and updates zoning to accommodate population growth projected from climate-driven relocation
– Boise incorporates wildfire risk data into its expansion plans, creating defensible space requirements in new developments
– Huntsville uses flood zone mapping to steer growth toward lower-risk areas while preserving wetlands that buffer existing communities
– Asheville plans infrastructure capacity based on models showing climate migration to the southern Appalachians
Youth-led initiatives are accelerating these practical applications. Portland’s Youth Climate Council advises the city on climate budgeting, while student groups in Ann Arbor successfully advocated for pedestrian infrastructure improvements that reduce emissions. High school students in Fort Collins conducted heat mapping that identified where the city needed more shade coverage.
Bipartisan collaboration appears most strongly in infrastructure projects where climate facts align with economic development goals. Republican and Democratic mayors across the Great Lakes region jointly secured federal funding for climate-resilient water systems. Rural and urban counties in Colorado partnered on watershed protection that serves both agricultural and municipal needs. These collaborations succeed because climate facts provide neutral ground, temperature records, precipitation trends, and flood data don’t carry party labels, and the infrastructure serving everyone benefits from planning that accounts for changing conditions.
Economic and Job Opportunities in Climate-Responsive Urban Planning
Climate facts don’t just reveal risks, they unlock economic opportunities. Cities responding to climate data are creating thousands of jobs in fields that barely existed a decade ago, from flood-resilient infrastructure design to urban heat mapping. The economic case for climate-responsive planning now draws bipartisan support: investing in resilience generates construction jobs, reduces future disaster costs, and attracts businesses seeking stable, forward-thinking locations.
Young professionals entering urban planning today find expanding career paths in resilient infrastructure engineering, where designers create flood barriers, elevated transit systems, and stormwater management networks based on sea level rise projections and precipitation data. Green building specialists translate temperature and energy data into code requirements, creating demand for professionals who understand both climate science and construction. Urban forestry positions are multiplying as cities recognize that tree canopy targets aren’t just environmental goals, they’re measurable responses to urban heat island facts, with arborists and planners working together to cool neighborhoods degrees at a time.
Climate data analysts have become essential city staff, interpreting projections and vulnerability assessments that inform multi-million dollar infrastructure decisions. These roles require skills in GIS mapping, statistical modeling, and translating technical climate information into accessible guidance, the same clarity needed to explain to kids why their city is building differently. Community engagement specialists develop community messaging around climate adaptation plans, ensuring residents understand how climate facts drive changes in their neighborhoods.
Federal infrastructure legislation has made climate-responsive planning a budget priority rather than a partisan issue, with funding flowing to cities that base projects on climate evidence. For young people choosing careers, this represents a rare alignment: work that addresses climate facts, enjoys political support, pays competitively, and builds the cities where we’ll actually live.
Common Questions About Climate Facts and Urban Planning
How long does it take for climate-responsive urban planning changes to show results?
Some interventions like reflective pavement or urban tree planting can reduce local temperatures within months, while major infrastructure projects like flood management systems or transit networks typically take 3-10 years from planning to completion. The timeline depends on project scale, funding availability, and community approval processes.
Are climate facts about cities reliable enough to base expensive infrastructure decisions on?
Yes. Climate projections for urban areas combine global climate models with local historical data, giving planners confidence intervals for temperature increases, precipitation changes, and sea level rise specific to their region. Cities don’t need perfect precision to act, they design for ranges of scenarios rather than single predictions.
How can young people get involved in climate-responsive urban planning?
Attend city planning commission meetings, join local climate action committees, or participate in public comment periods for zoning changes and infrastructure projects. Many cities now have youth advisory boards focused on sustainability, and creating effective posters to act at community events raises awareness about specific planning issues.
Does climate-responsive planning cost more than traditional urban development?
Upfront costs are often higher, but life-cycle analysis shows savings through reduced energy use, lower disaster recovery expenses, and avoided infrastructure damage. A green roof costs more initially than conventional roofing but extends roof lifespan by decades while cutting cooling costs, and permeable pavement reduces the need for expensive stormwater systems.
The questions above reflect what city council members, students interested in planning careers, and community advocates actually ask when climate data enters the conversation. The cost question especially cuts across political perspectives, fiscal conservatives and climate activists both want to know whether these investments make economic sense.
One concern that doesn’t appear in formal meetings but surfaces in community forums is whether individual neighborhoods get left behind when cities pursue climate adaptation. Fair distribution of climate-responsive infrastructure matters enormously. Heat island effects hit low-income neighborhoods hardest because they have less tree cover, and flooding disproportionately affects communities that were historically zoned into floodplains. Equity-focused planning ensures climate facts drive investments in all neighborhoods, not just wealthy districts.
Another practical question: what if the climate facts change or projections get updated? Planners build flexibility into infrastructure by designing systems that work across a range of scenarios. A park designed to absorb stormwater performs that function whether annual rainfall increases 10% or 20%, and bike lanes serve residents regardless of whether summer temperatures rise three degrees or five.
how it works
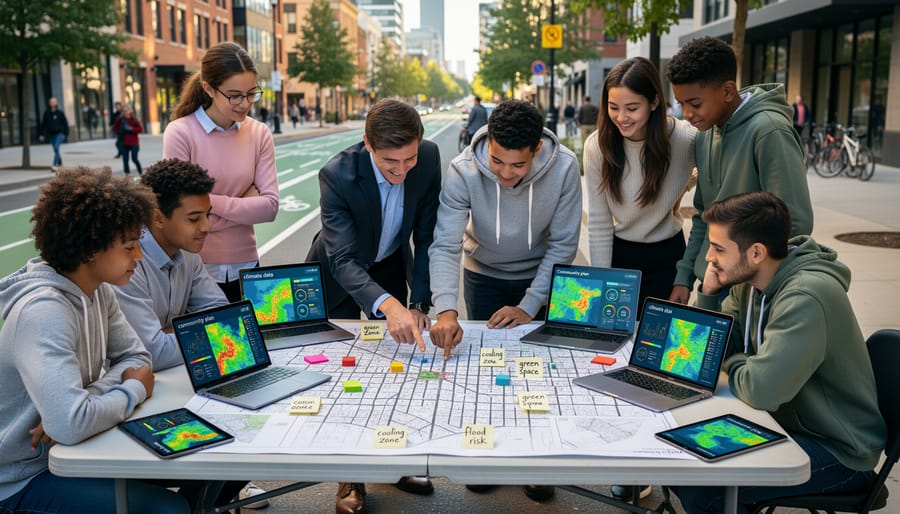
Climate change facts move from scientific observation to city action through a structured process. First, climate scientists collect temperature data, rainfall patterns, sea level measurements, and extreme weather frequency from satellites, weather stations, and historical records. This raw data becomes climate change facts when peer-reviewed research confirms consistent trends over time.
Urban planners access these facts through climate models and regional assessments published by national weather services, universities, and environmental agencies. A city planning department receives projections showing, for example, a 15% increase in heavy rainfall events or three additional heat waves per summer by 2050. Planners then translate these facts into specific risks for local infrastructure, housing, and public health.
The facts drive concrete decisions. If data shows flooding risk doubling, planners update stormwater codes, redesign drainage systems, and restrict development in vulnerable areas. Rising heat facts lead to urban tree canopy targets and cool pavement standards. Each climate change fact connects directly to a planning action, creating a feedback loop where implementation results get measured against the original data.
This evidence-based approach works across political perspectives because the facts themselves are measurable and verifiable, making climate-responsive urban planning a practical rather than ideological exercise.
Types or components
Climate change facts used in urban planning fall into four essential categories that help cities build evidence-based resilience strategies.
Temperature and Heat Data tracks rising average temperatures, heat wave frequency, and urban heat island effects. This component informs decisions about cooling infrastructure, building materials, and green space placement. Cities use this data to map vulnerable neighborhoods and prioritize shade coverage.
Precipitation and Water Facts encompasses rainfall pattern changes, drought frequency, and flood risk projections. Planners apply this information to stormwater systems, water supply planning, and wetland protection. This component drives investments in permeable surfaces and reservoir capacity.
Sea Level and Coastal Impact Data measures ocean rise rates, storm surge patterns, and shoreline erosion. Coastal cities rely on these facts for zoning decisions, infrastructure relocation, and protective barrier design. This component shapes long-term land use policies.
Extreme Weather Metrics quantifies the frequency and intensity of hurricanes, wildfires, and severe storms. These facts guide emergency response planning, building code updates, and evacuation route design. Cities use this data to strengthen critical infrastructure and establish resilience hubs that serve communities during climate events.
Climate change facts aren’t debatable talking points. They’re the concrete data that engineers reference when designing stormwater systems, that city councils cite when updating building codes, and that developers consult when choosing where to build. These facts transcend political affiliation because flooded streets, scorching heat waves, and crumbling infrastructure affect everyone equally. When planners use evidence-based climate data to guide decisions, they’re protecting property values, public health, and economic vitality for entire communities.
The most encouraging aspect of climate-responsive urban planning is that young people are already shaping it. From college students conducting climate vulnerability assessments for local governments to recent graduates designing green infrastructure projects, this generation brings fresh perspectives to resilience planning. Many cities now include youth advisory boards in their climate planning processes, recognizing that today’s students will inherit the urban environments being designed now. The career opportunities in this field span architecture, engineering, data science, public policy, and community organizing, creating pathways for anyone passionate about building better cities.
Getting involved doesn’t require a planning degree. Attend your city’s public hearings on zoning changes or infrastructure projects. Join a local climate action group. Volunteer with organizations working on urban greening initiatives. Comment on draft climate adaptation plans during public review periods. Run for positions on planning commissions or neighborhood councils. These aren’t symbolic gestures. Public input genuinely influences how cities allocate resources and prioritize projects.
The cities we build today determine whether future generations thrive or struggle. Climate facts give us the foundation to choose wisely, and the planning process gives everyone a voice in that choice.